
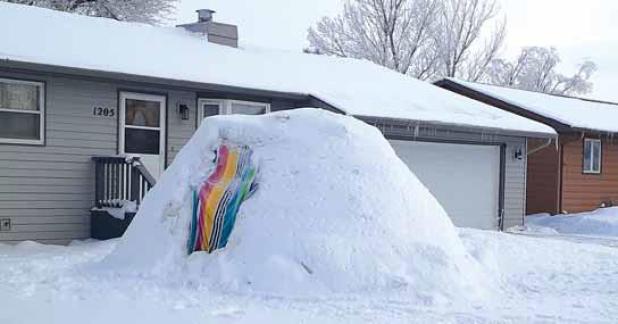
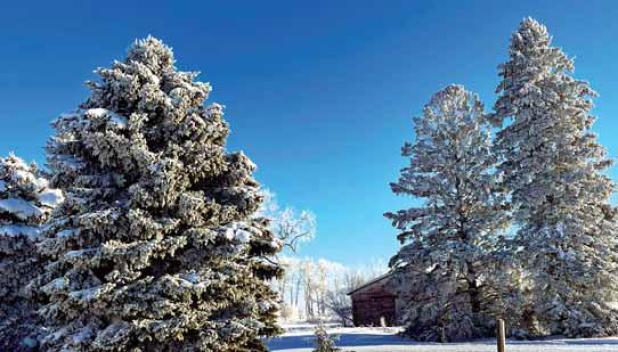
Above, several area youths used all the white stuff on the ground in the last weeks to build a large snow igloo. The igloo is in the yard of Tate Davidson’s home on 9th Street in Britton. The structure is big enough for people to stand inside it. It has stood now for several weeks. Below, Jennifer Gustafson captured the beauty of a clean, blue winter morning earlier this week. She took the photo at her family’s farm south of Claremont.
Wet, Dry, Wet: 2022’s Weather Roller Coaster
It was bumpy road when it came to 2022’s precipitation totals. Yet, in the end, this year’s moisture total looks pretty similar to 2021. Last year, local reporters measured 20.31 inches of precip. And despite this year’s seemingly extreme swings, we came in at 19.91 inches in 2022. This total put the area on par with the 100 year average of 20.04 inches of moisture.
The year started off wet. The precipitation totals in the first five months, with the expectation of March, were significantly wetter than the average for those months. January snow totals led to .83 inches of moisture, while the average is .51. Feburary’s .62 inches was slightly above the average of .56. March marked below average levels.
The next two months of 2022, April and May, were extremely wet, to the point of approaching records. April brought 3.84 inches of moisture. According to Journal records, this was the highest precip total in that month since April of 1991 where 3.98 inches were recorded. (In April of 1986, 7.27 inches were recorded). In May of this year, Journal Country saw 4.78 inches. The average is 2.76 inches. This is the wettest May since 2015 where 5.71 inches of moisture was measured.
The wetness then started to dwindle. June’s 3.16 inches was less than the 100 year average of 3.75. The next four months, July through October, were significantly dryer. July’s 1.41 inches was only about 50% of the average moisture for that month. (10.64 inches of precip was recorded in July of 2018). August was again dry at 1.77 inches, below the 2.43 average for that month.
September and October were bone dry, with .18 and .07 inches of moisture respectively. The averages are 2.04 and 1.35 for those months. September ranked as the driest since that month in 2011 where only .05 inches was marked. This year also puts the October moisture total as the second driest ever measured, according to the Journal’s record, with October of 1916 only having seen a trace amount of precip.
The tides changed again late this year when sleet, ice, and eventually snow started to tick up the moisture levels. November saw .86 inches of precip, above of the .77 inch 100 year average.
December’s snows amounted to 2.1 inches of moisture, significantly topping the .41 inch average. This was second wettest December, with only 2009 measuring more when 2.69 inches were recorded.
The moisture levels throughout this year led a fair share of headaches, including wet calving and planting seasons. Dry conditions in the later part of the growing season led farmers to pray for rain. Yet, overall yields were better than expected.